Northern Lights Calendar: Eight Cities, Month by Month
Use an eight-city aurora calendar to compare monthly darkness, historical activity and cloud normals, with downloadable data and clear methods.
A northern-lights calendar should help with one practical decision: which months are worth monitoring for a destination. It should not promise a display, turn a cloud average into a probability, or treat the Northern Hemisphere as the whole aurora story.
This calendar compares Fairbanks, Yellowknife, Reykjavík, Tromsø, Rovaniemi, Abisko, Hobart and Queenstown. It uses three separate inputs: the observed planetary Kp record, calculated local astronomical darkness and NASA POWER cloud normals. The first six cities show the northern seasonal cycle; Hobart and Queenstown show why an austral calendar has to be read differently.
The primary calendar: Kp observations crossed with darkness
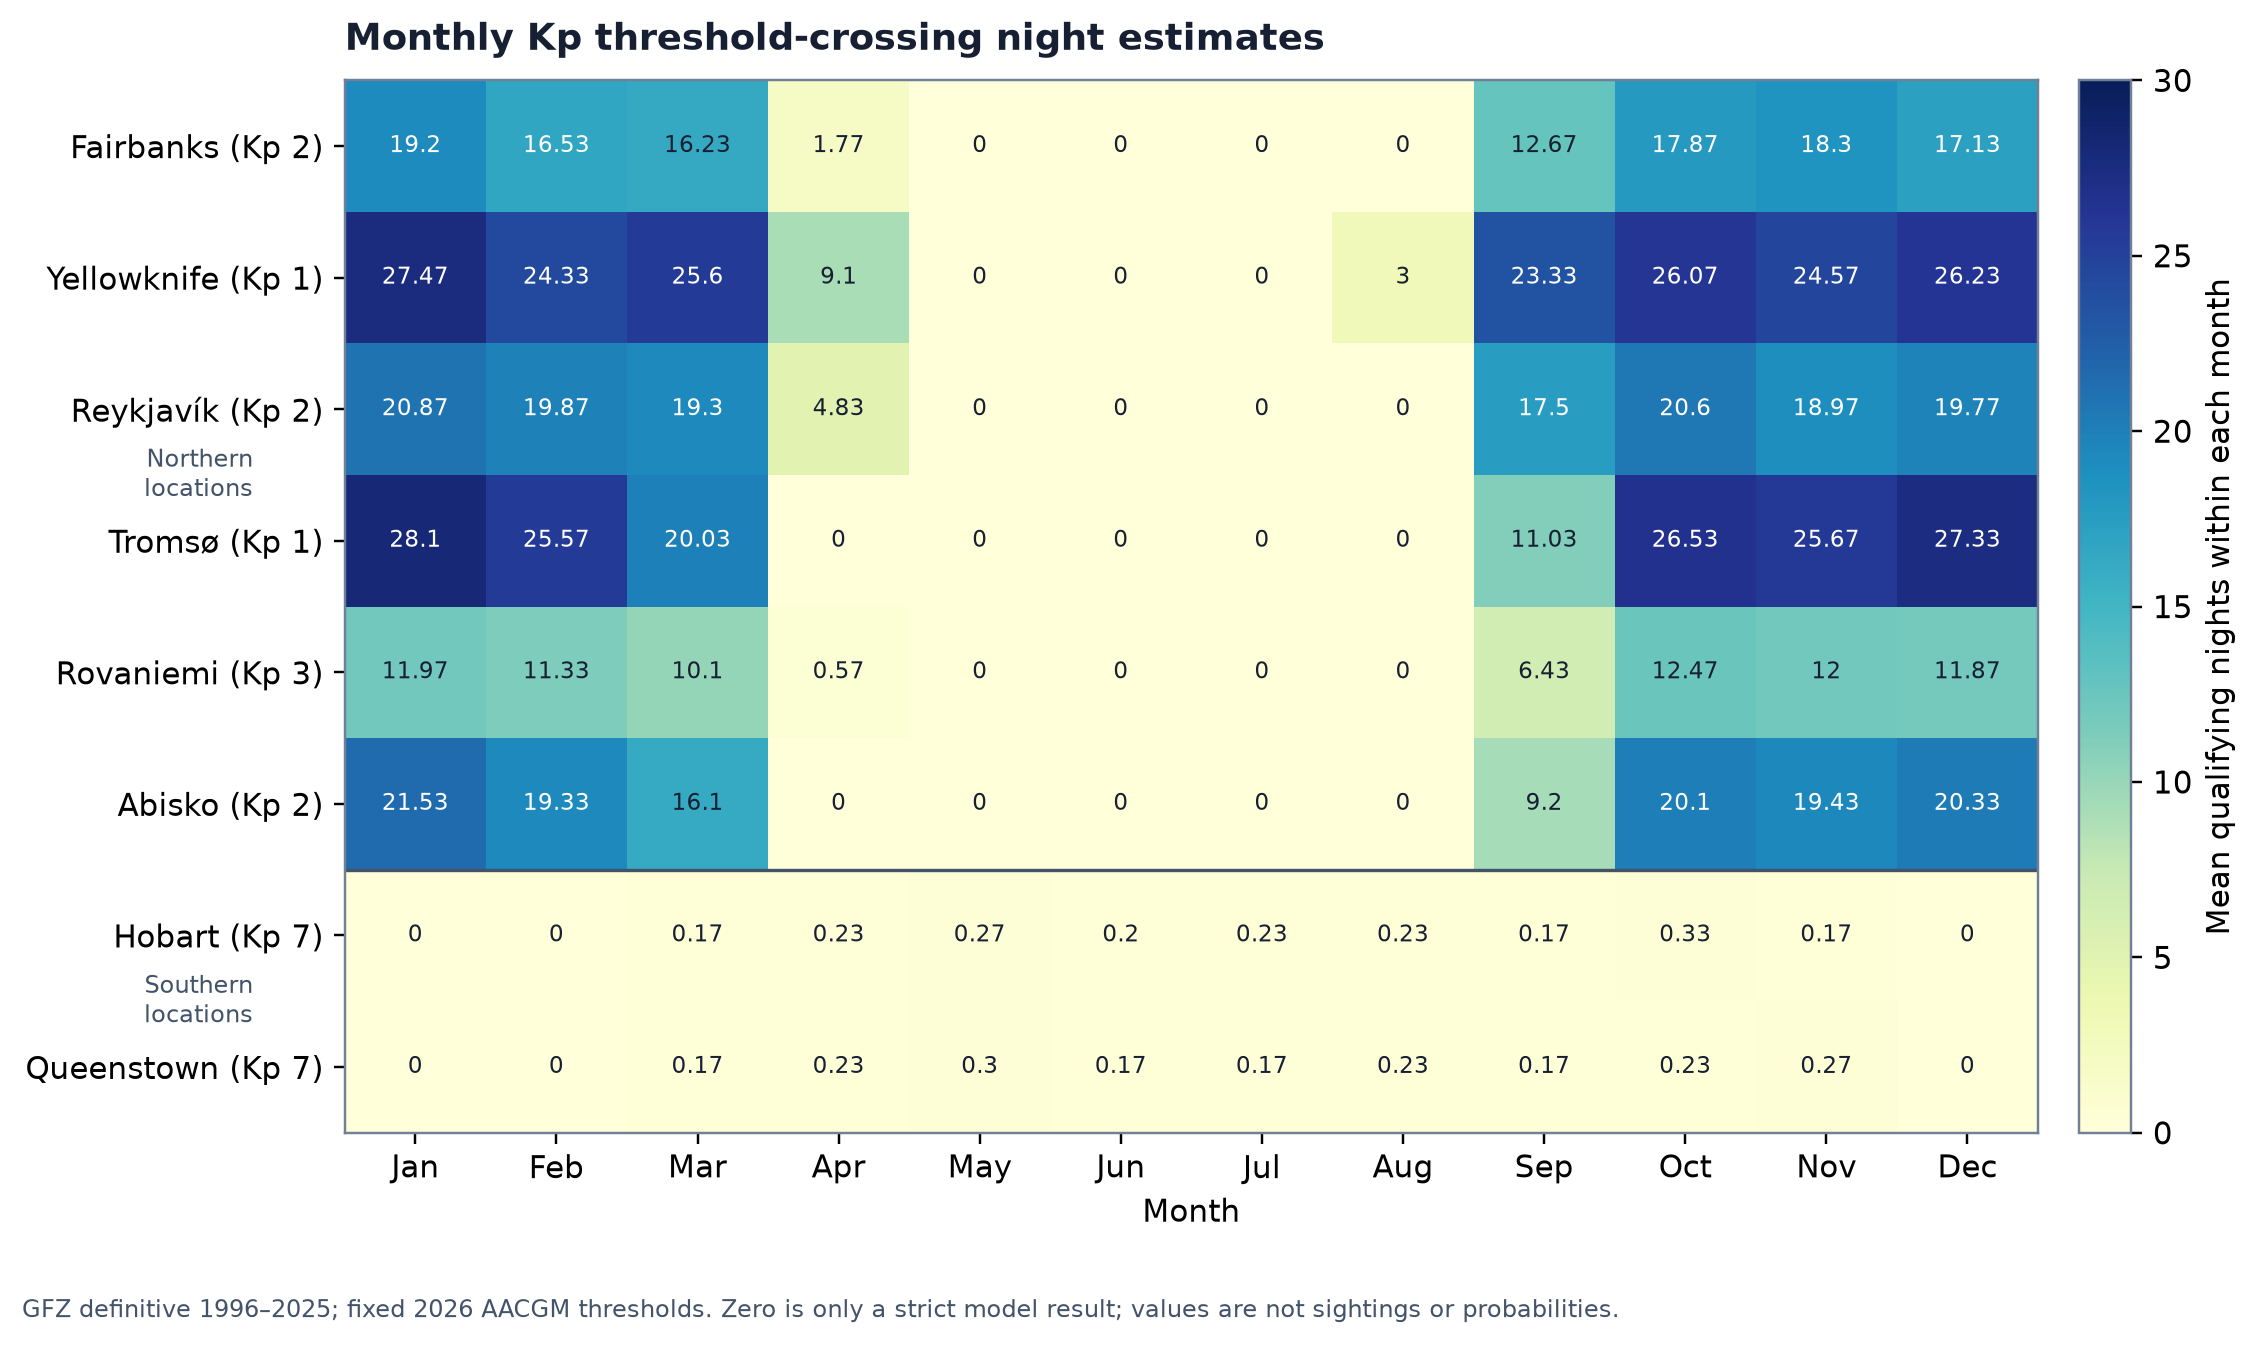
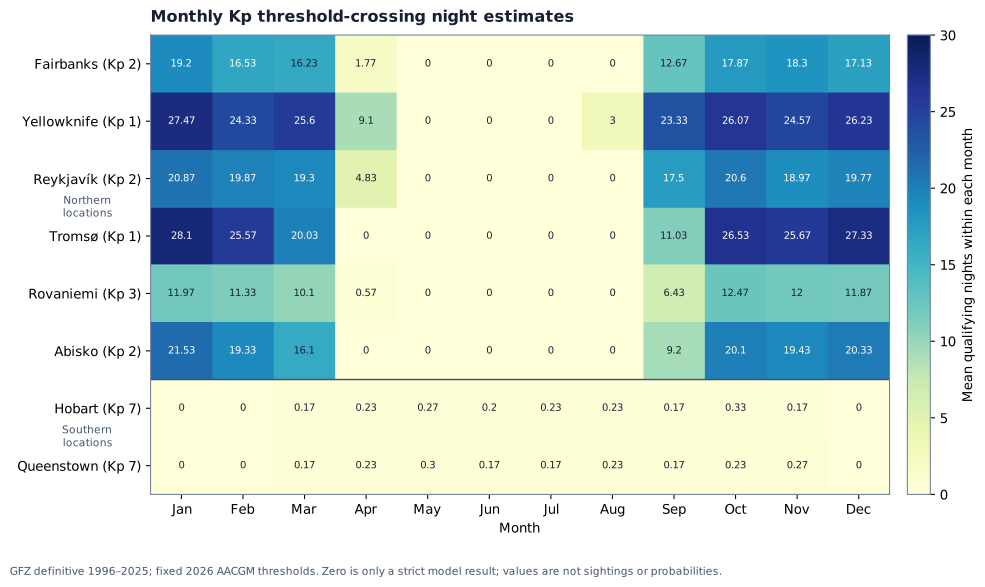
The main heatmap is not an aurora-sighting map. Each cell is the estimated number of calendar nights per year in 1996–2025 that contained at least one observed three-hour GFZ planetary Kp interval at or above the city’s fixed threshold while astronomical darkness was calculated. It is a planning baseline, not a percentage chance or a forecast for a particular trip.
| City | Fixed 2026 AACGM latitude | Kp threshold | Annual Kp-threshold crossing-night baseline |
|---|---|---|---|
| Fairbanks | 65.2° | Kp 2 | 119.70 |
| Yellowknife | 68.5° | Kp 1 | 189.70 |
| Reykjavík | 64.2° | Kp 2 | 141.71 |
| Tromsø | 67.3° | Kp 1 | 164.26 |
| Rovaniemi | 63.8° | Kp 3 | 76.74 |
| Abisko | 65.9° | Kp 2 | 126.02 |
| Hobart | 53.7° | Kp 7 | 2.00 |
| Queenstown | 52.6° | Kp 7 | 1.94 |
The Arctic rows have a much larger baseline than the two southern rows under the fixed 2026 geometry. That is not a count of actual auroras or an instruction about where to travel. It says that a global Kp interval reaches the model threshold more often during calculated darkness in those city rows. The southern rows are event-sensitive: their seasonal calendar is useful for locating darkness, but a live aurora oval and local conditions carry more weight for a real night.
Darkness makes the season, but not every dark hour is equal
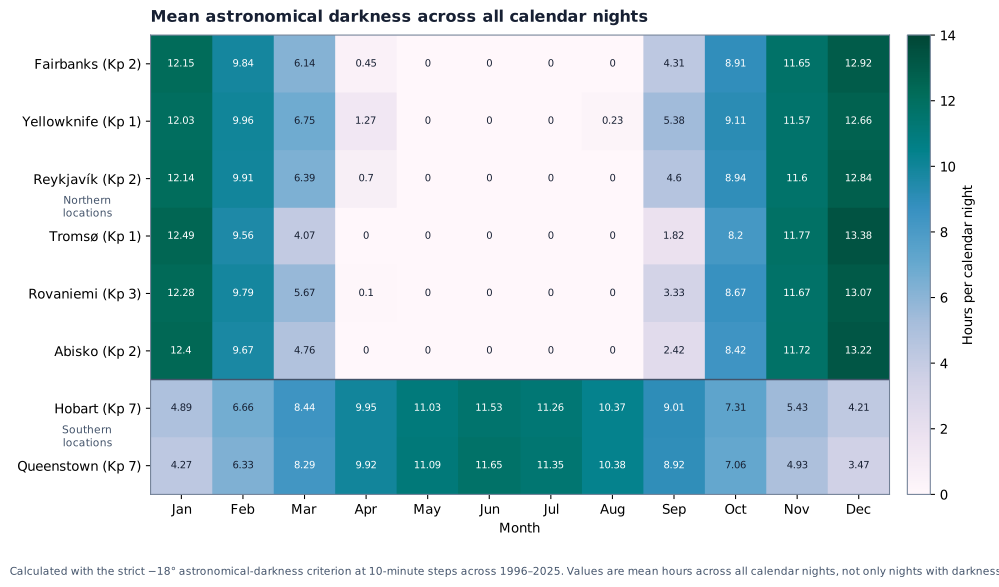
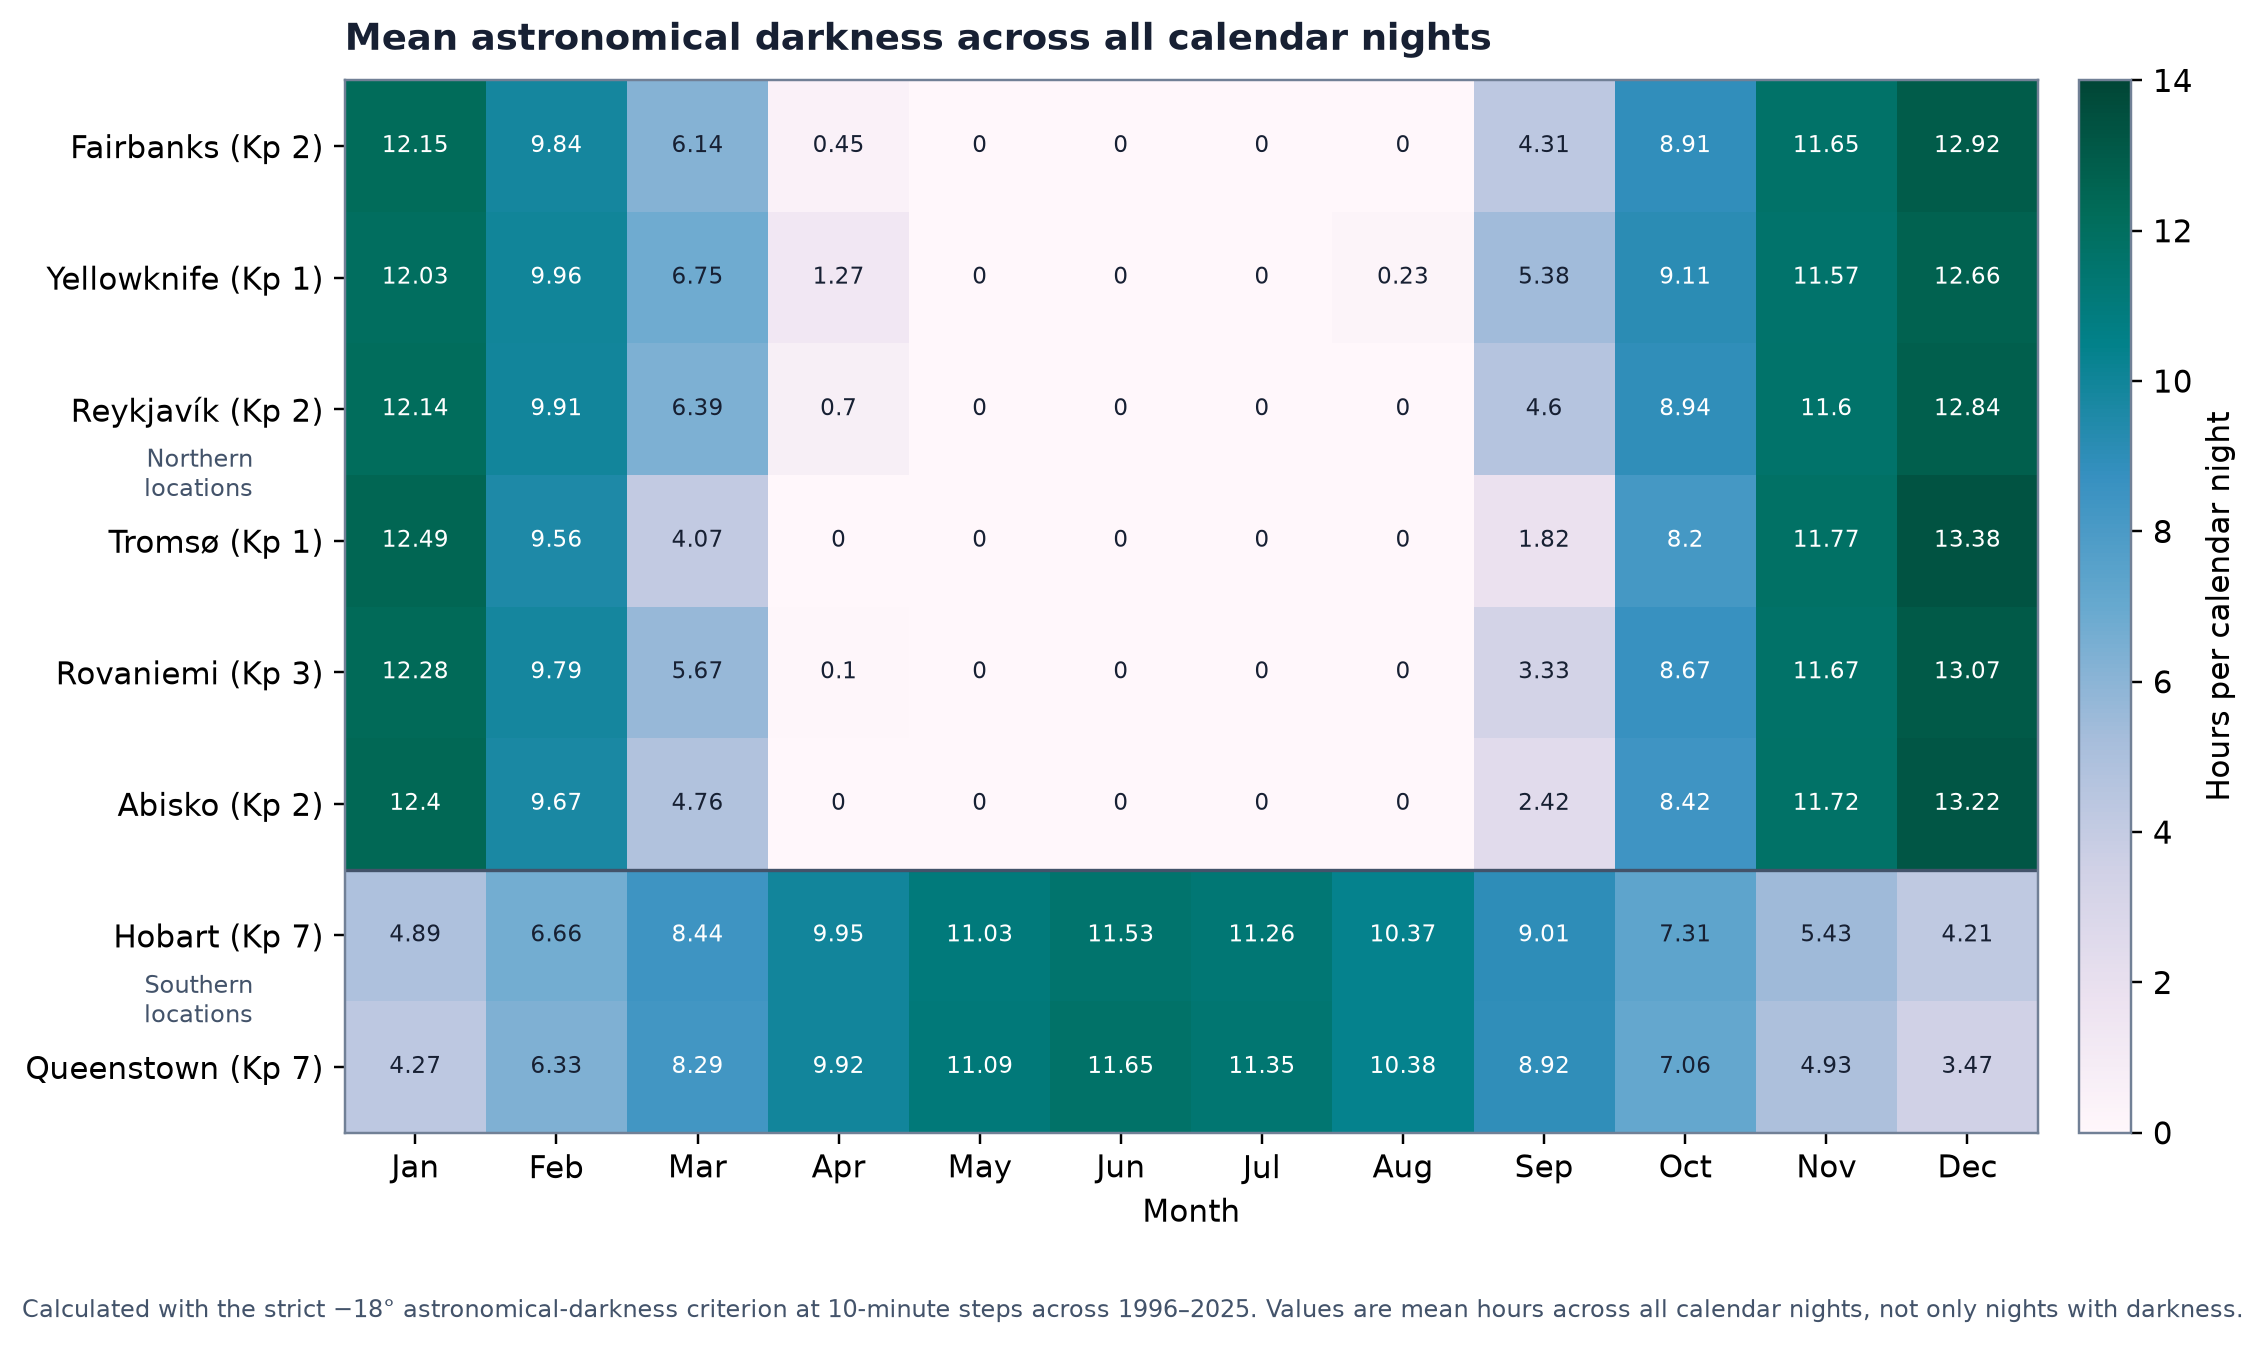
The figure uses all-calendar-night hours, not the conditional average only. That distinction matters in shoulder months. A month can have several hours of darkness on its qualifying nights while only a small fraction of calendar nights qualifies.
Yellowknife shows the clearest example. May through July have zero modeled astronomical darkness. August is not zero: 13.4% of calendar nights qualify, with a mean 1.68 hours on qualifying nights, and the Kp/darkness baseline is 3.00 nights per year. By September, every calendar night qualifies in the model and the Kp/darkness baseline is 23.33 nights. The calendar therefore distinguishes a narrow August shoulder from the return of a full dark-night season.
Fairbanks, Reykjavík, Tromsø, Rovaniemi and Abisko have zero May–August cells under the strict astronomical criterion. That does not mean aurora cannot be noticed in twilight; it means the calculation intentionally excludes twilight. NOAA explains that aurora is not visible in daylight and that bright aurora can sometimes be observed from a distance when conditions allow (NOAA SWPC).
For the southern pair, the calendar turns over. Their useful darkness season falls around austral autumn and winter, not the northern winter. A global calendar should make that inversion explicit rather than presenting September–March as a universal rule.
Cloud normals are a separate planning layer
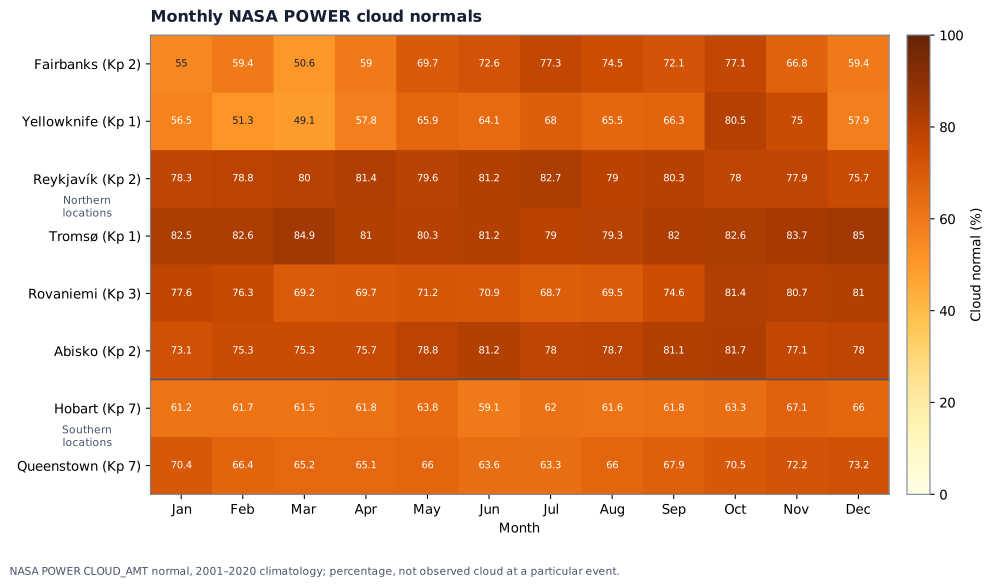
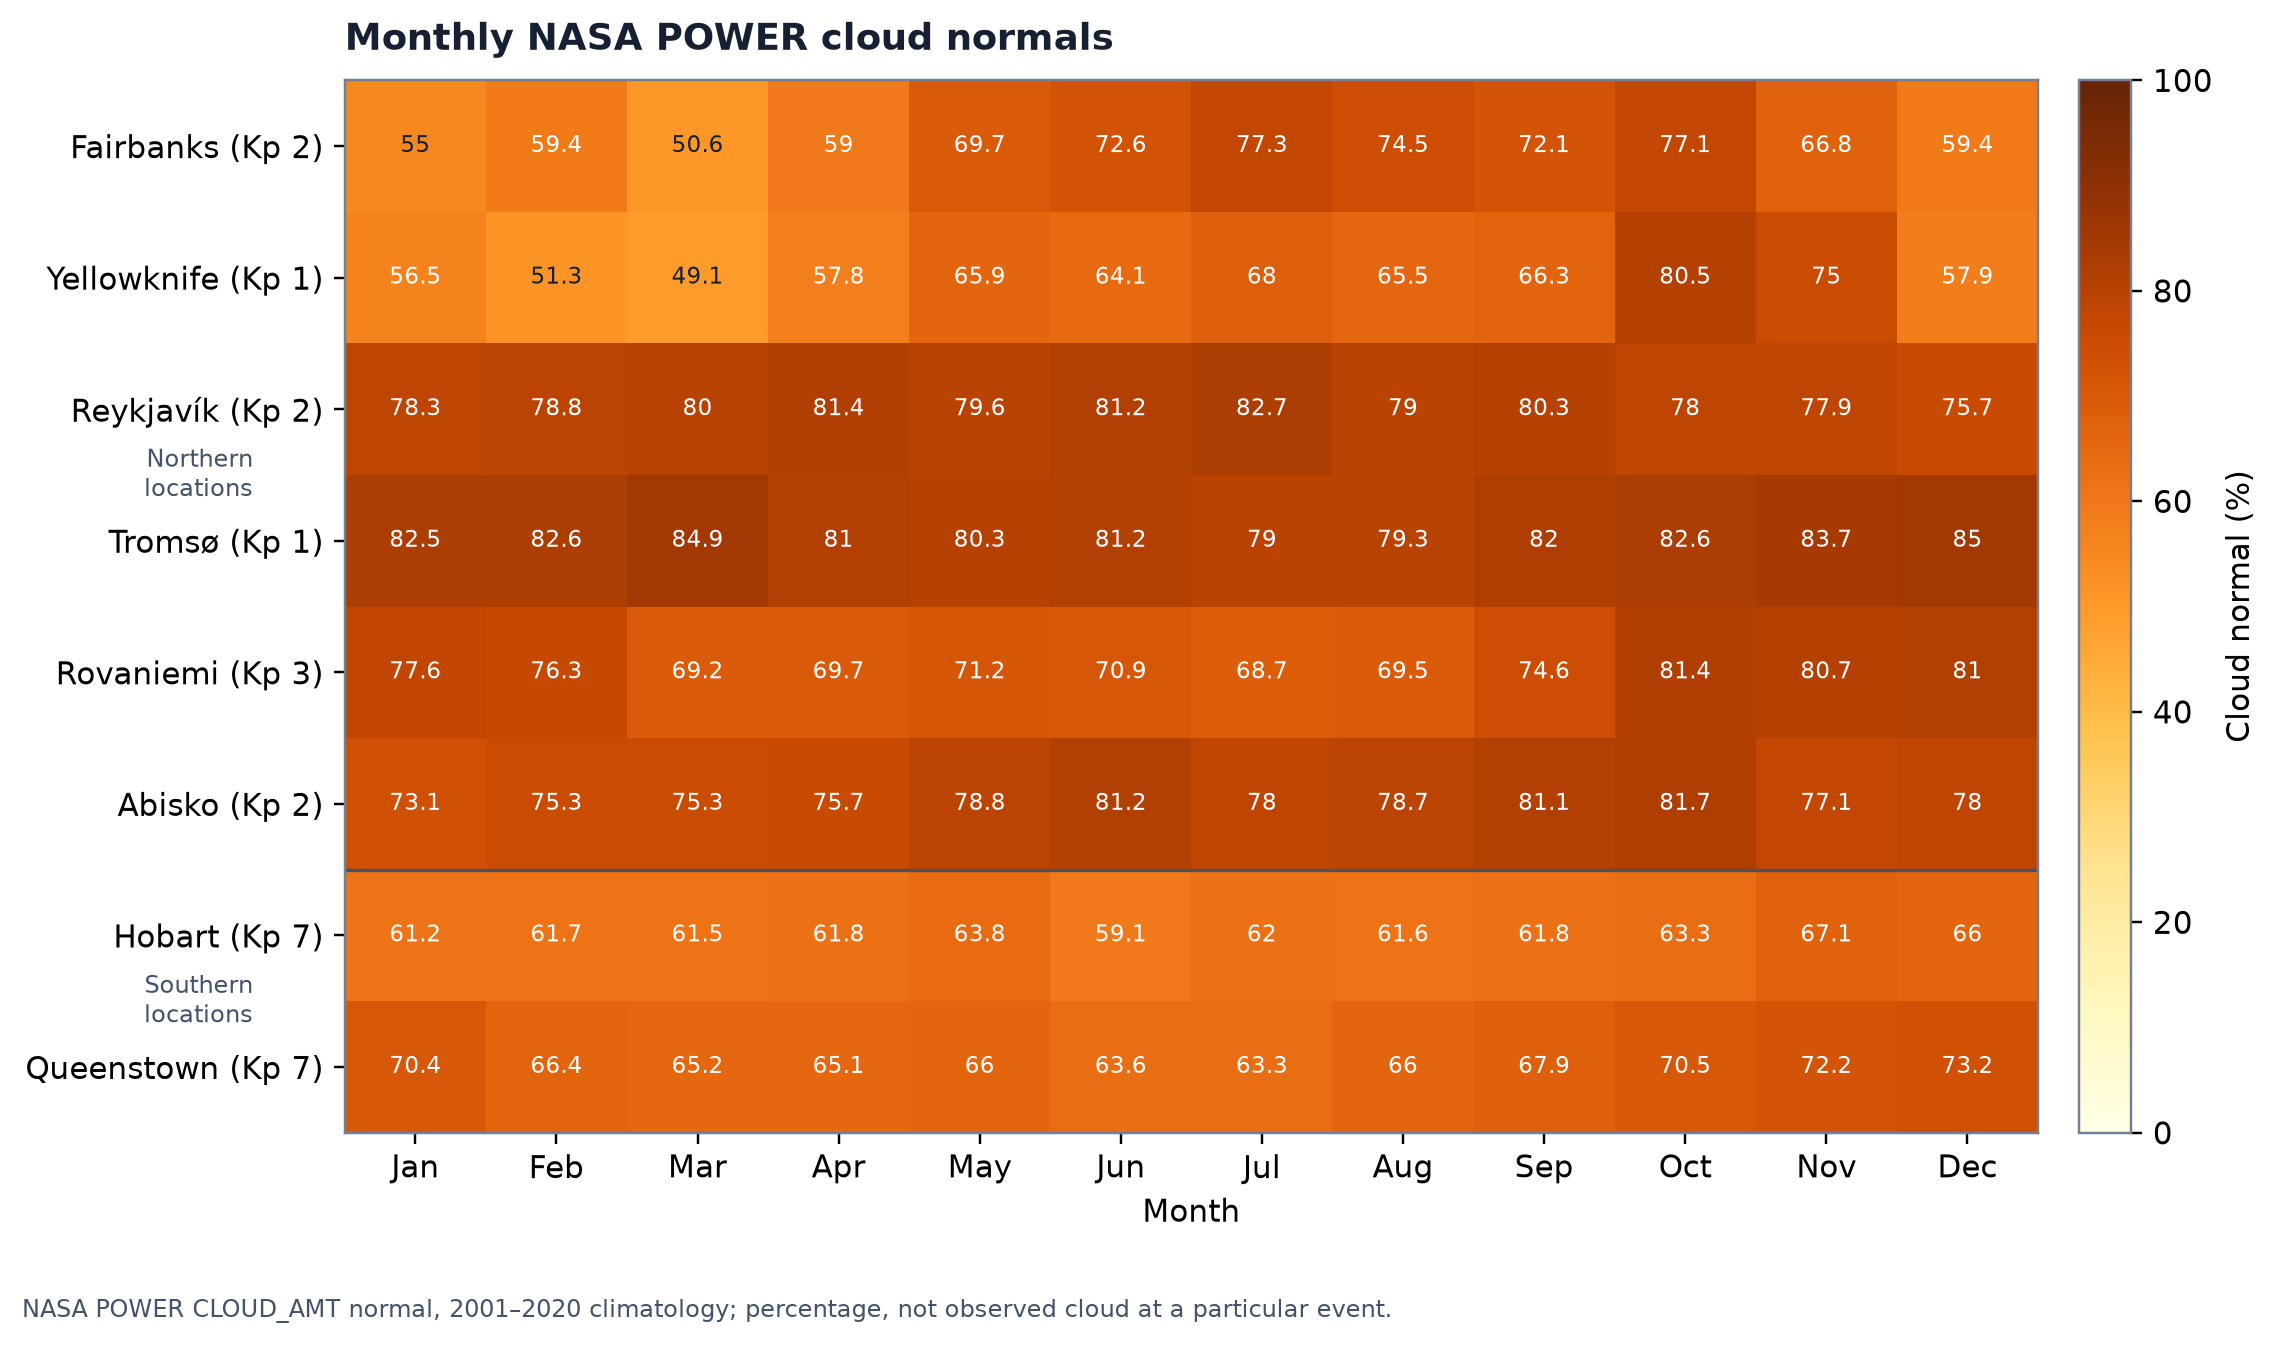
Read the cloud heatmap alongside the Kp heatmap, not as a hidden adjustment to it. Yellowknife’s mean cloud amount is 56.5% in January, 51.3% in February and 49.1% in March, before rising to 80.5% in October. The Kp/darkness baseline remains high in both March (25.60 nights/year) and October (26.07), so the two panels describe a real seasonal trade-off without claiming which individual week will be clearer.
Gridded cloud normals cannot resolve a city’s local microclimate, terrain, coast-versus-inland differences or a short-lived weather break. They are useful for comparing the long-run monthly background, not for estimating a trip outcome. If a cloud-scaled Kp/darkness value is ever shown, it belongs in methods as an optional heuristic sensitivity—not as the calendar’s principal measure and never as “expected visible nights.”
Reading the calendar by hemisphere
In the northern group, read the figure for a broad season: look for darkness first, then the Kp/darkness baseline, then the cloud panel as a contextual long-run normal. For example, Yellowknife’s late-August return of limited darkness is meaningfully different from its January-to-March winter pattern. Fairbanks, Tromsø, Rovaniemi and Abisko require a later return of strict astronomical darkness after summer.
In Hobart and Queenstown, start with the opposite seasonal page of the calendar. Their Kp 7 thresholds mean a dark month by itself does not create a high Kp/darkness baseline. That is not a claim that aurora will not occur; it is a reason to use current geomagnetic and aurora-oval data before making an evening plan.
What replaces the calendar on a real night
For a date weeks or months away, the calendar supplies a seasonal reference. For the night itself, it must give way to a live aurora forecast, local cloud forecast, current darkness and moonlight, plus a safe viewing location. NOAA’s OVATION product forecasts aurora location and intensity about 30–90 minutes ahead (NOAA SWPC); it is not a substitute for the historical calendar, and the calendar is not a substitute for it.
Methods and limits
GFZ’s Kp index is a three-hourly planetary index based on 13 observatories (GFZ Potsdam). This calculation uses 87,664 complete definitive (def) intervals spanning 1996-01-01 00:00 UTC through 2025-12-31 21:00 UTC, under CC BY 4.0. Attribute GFZ German Research Centre for Geosciences and retain the linked GFZ data-publication DOI.
Each three-hour Kp interval is represented by its midpoint for the darkness test. Solar nights are bucketed from local solar noon to the next local solar noon using longitude/15, without daylight-saving time; darkness hours use a separate 10-minute solar grid. Shorter-than-three-hour activity and partial overlap with darkness remain unresolved, so the calculation does not claim continuous night windows.
Astronomical darkness was calculated every 10 minutes with a strict −18° solar-altitude threshold. AACGM-v2 2.7.1 at epoch 2026-07-01 and 110 km altitude supplies the current 2026 AACGM magnetic latitude and Kp threshold held fixed throughout 1996–2025, a stable reference rather than historical geometry reconstruction. The sensitivity analysis changes Reykjavík and Abisko from the older static Kp 1 ladder to Kp 2, and Hobart and Queenstown from Kp 8 to Kp 7; those assumptions must remain visible.
NASA POWER CLOUD_AMT is all-day monthly mean point climatology for January 2001–December 2020, not night-only cloud data or historical cloud observations on the modeled Kp nights. NASA documents the underlying climatology API here: NASA POWER. It represents a monthly mean cloud amount, not a probability of clear sky or a count of clear nights.