Fairbanks vs Yellowknife, Tromsø vs Reykjavík: Aurora Data
Compare Fairbanks, Yellowknife, Tromsø and Reykjavík using historical Kp, calculated darkness and cloud normals, with monthly charts and model limits.
Fairbanks, Yellowknife, Tromsø and Reykjavík are often put in the same “best aurora destination” list. That shortcut misses the useful part: they have different darkness seasons, different current magnetic-latitude thresholds and different long-run cloud normals. A sensible comparison shows those components separately rather than declaring a universal winner.
This reference uses the complete 1996–2025 definitive GFZ Kp record, calculated local astronomical darkness, and NASA POWER monthly cloud normals. It does not count aurora sightings, predict the outcome of a trip or measure a city’s wider travel experience.
The four-city baseline
“Kp-threshold crossing nights” below means local nights with at least one observed three-hour planetary Kp interval at or above the fixed city threshold while the Sun was at least 18° below the horizon. It is a calculated overlap of a global geomagnetic observation and local darkness, not a count of visible auroras.
| Destination | Fixed 2026 AACGM magnetic latitude | Kp horizon threshold | Kp-threshold crossing nights/year |
|---|---|---|---|
| Fairbanks, Alaska | 65.2° | Kp 2 | 119.70 |
| Yellowknife, Canada | 68.5° | Kp 1 | 189.70 |
| Reykjavík, Iceland | 64.2° | Kp 2 | 141.71 |
| Tromsø, Norway | 67.3° | Kp 1 | 164.26 |
Yellowknife and Tromsø reach the reference threshold at Kp 1; Fairbanks and Reykjavík reach it at Kp 2. That is a property of the fixed 2026 AACGM geometry used to compare all 30 years. It does not mean a threshold crossing supplies a clear sky, a visible oval overhead, or an observable display at every moment in the three-hour Kp interval.
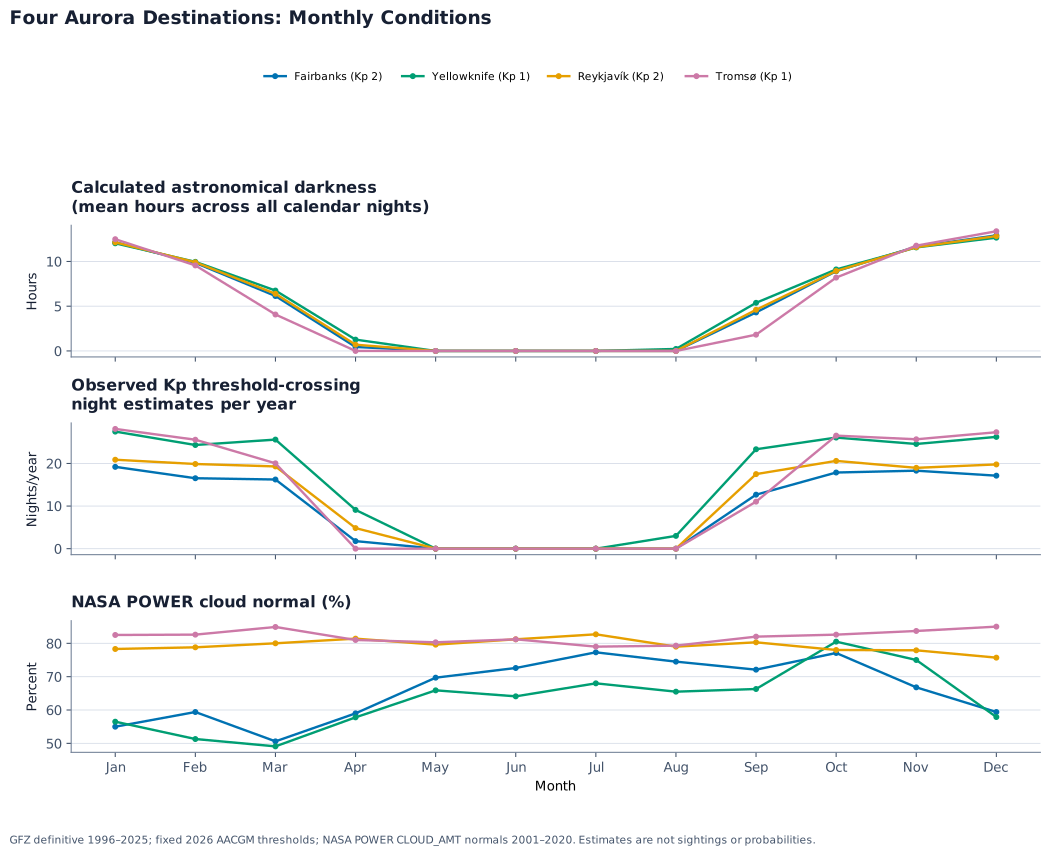
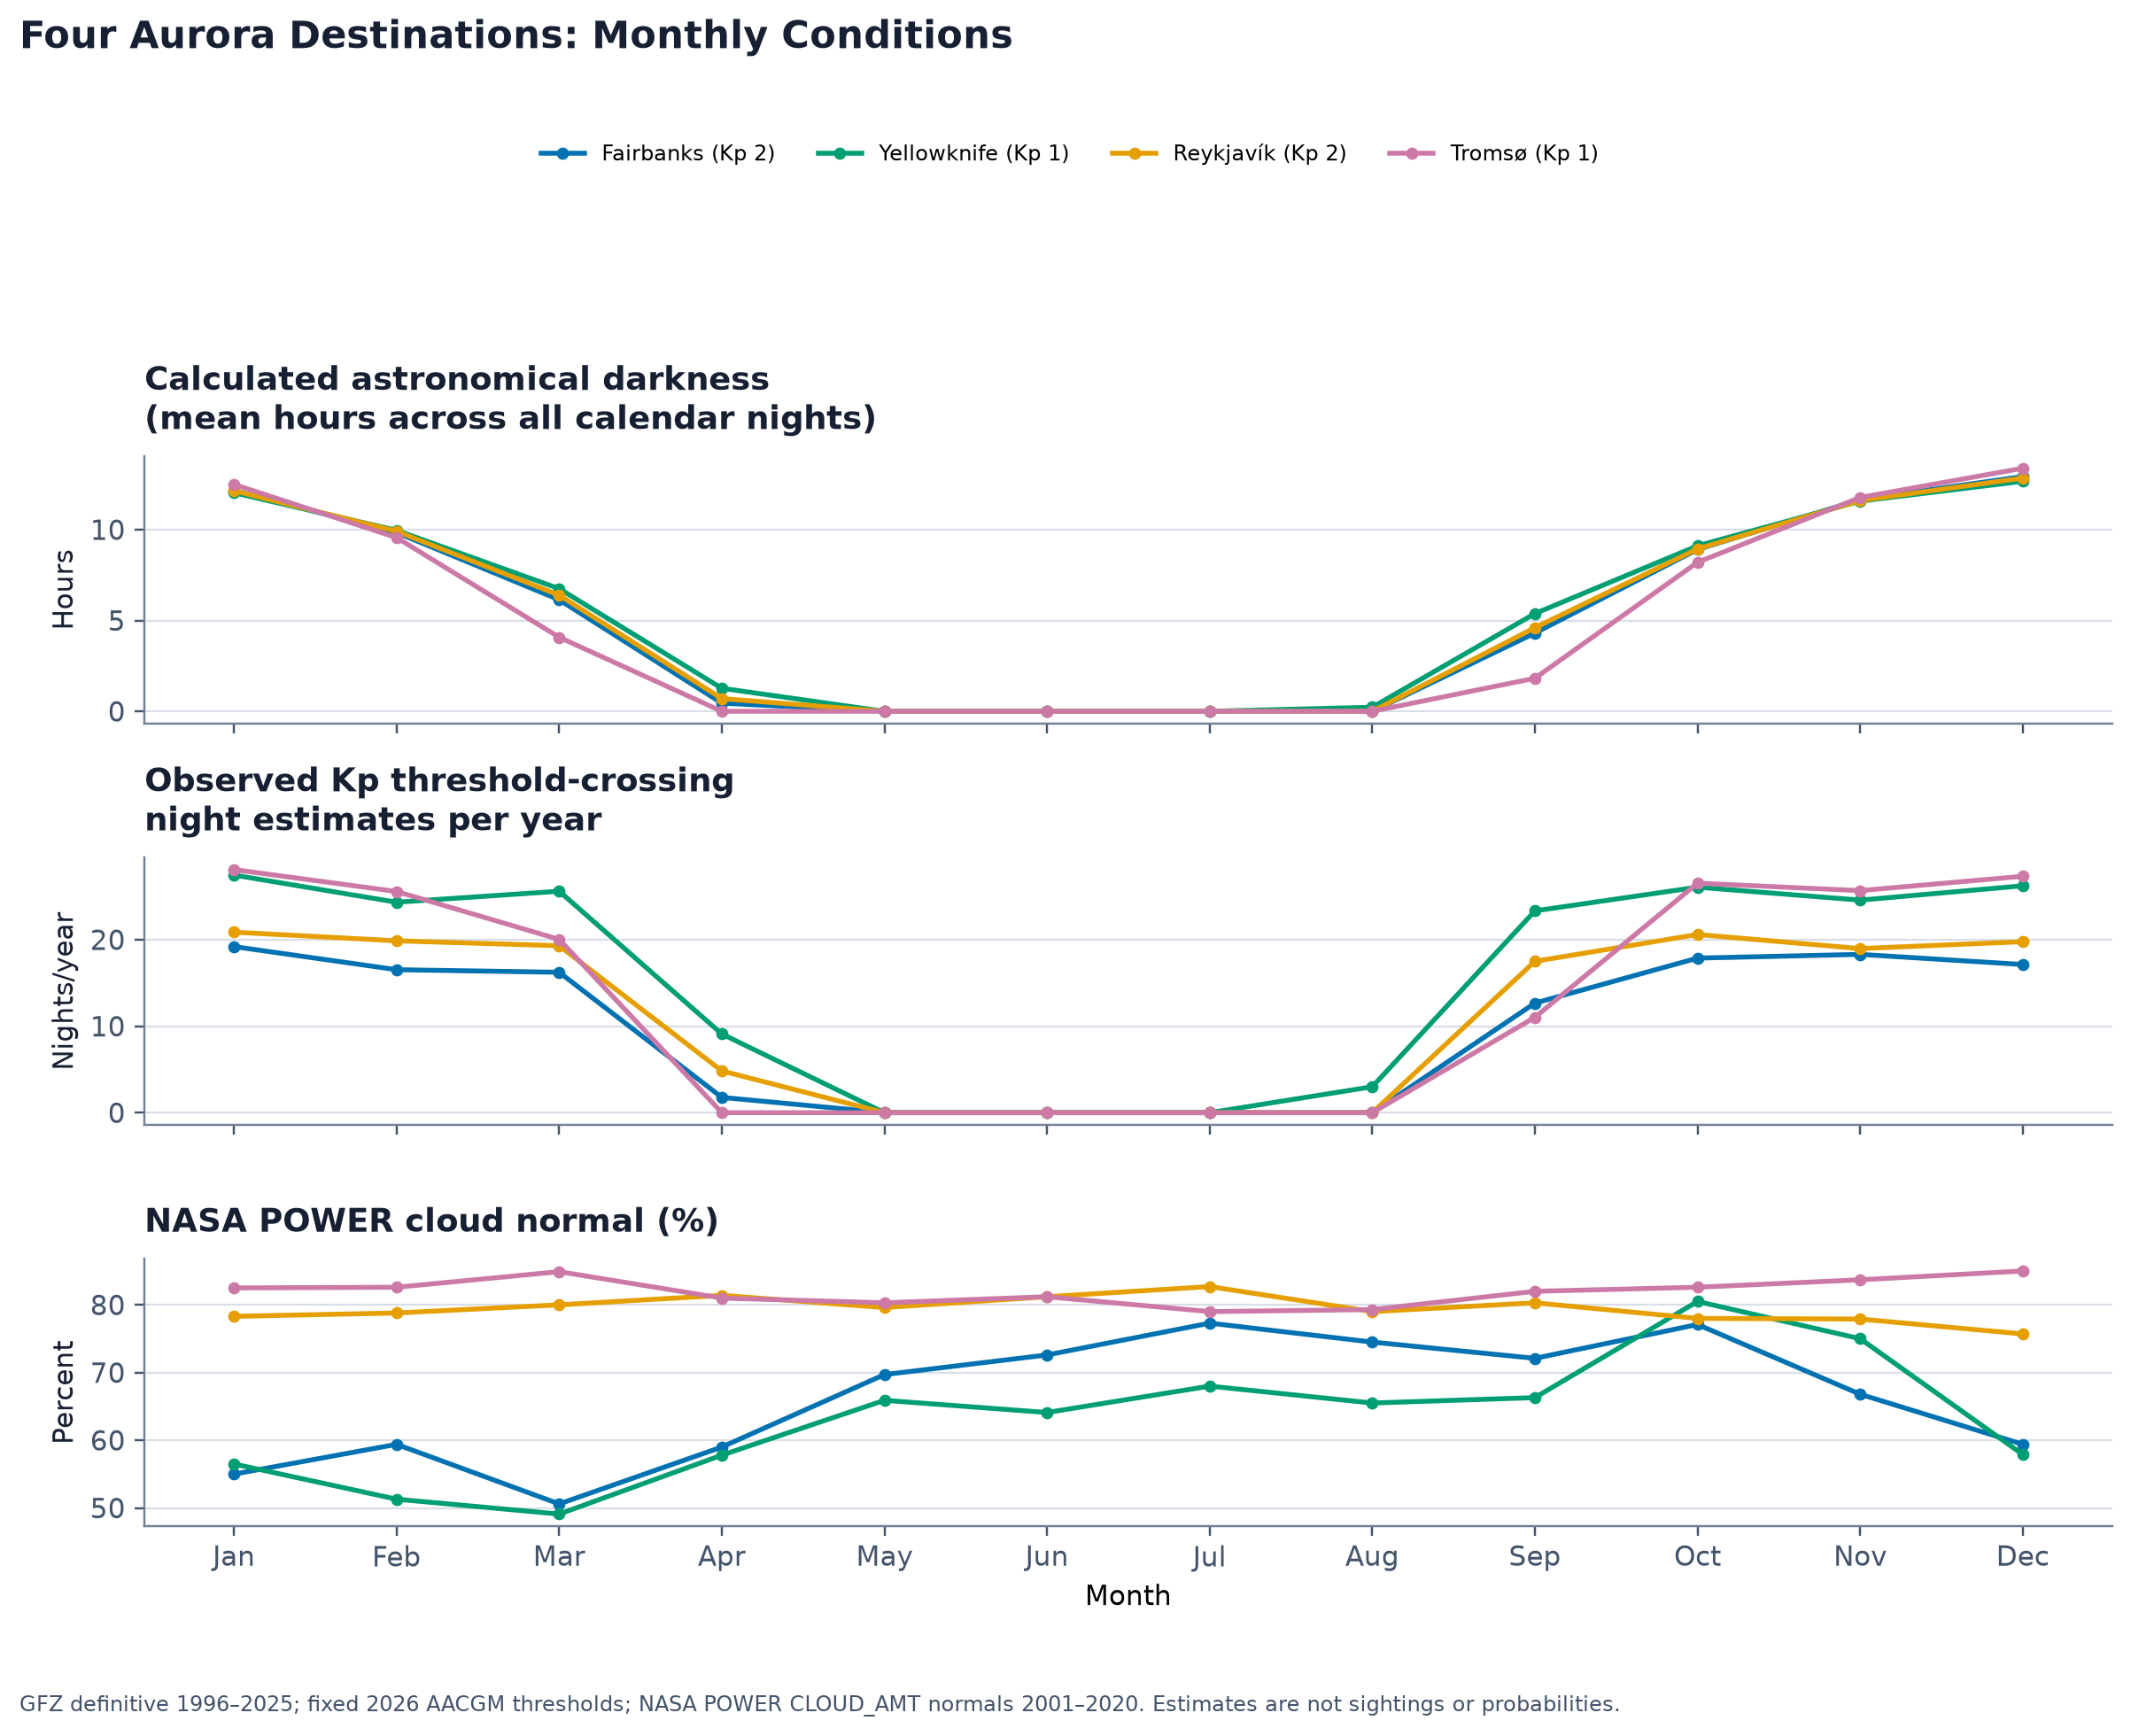
Figure 1 reports all-calendar-night darkness hours: conditional darkness hours on qualifying nights multiplied by the share of calendar nights that qualify. This avoids treating a few shoulder-season dark nights as if every night in the month had the same darkness.
What changes with the month
The Kp baseline is only one part of timing. Fairbanks has Kp-threshold crossing estimates of 19.20 nights in January, 16.23 in March and 17.13 in December. Yellowknife has 27.47 in January, 25.60 in March and 26.23 in December. The difference between January and March is therefore not a simple “more geomagnetic activity” story; darkness and cloud normals change too.
The cloud-normal panel explains a useful contrast without becoming a prediction. Yellowknife’s NASA POWER mean cloud amount is 56.5% in January, 51.3% in February and 49.1% in March; its March Kp-threshold baseline is 25.60 nights. Its October cloud normal is much higher, 80.5%, despite 26.07 threshold-crossing nights. A reader deciding between winter and early spring should see that trade-off directly, then use a live forecast for actual weather.
Fairbanks has a different pattern. Its January cloud normal is 55.0%, March is 50.6%, and the all-calendar-night darkness component contracts markedly by April. This makes January and March useful comparison months, but it is not a recommendation to book either one: monthly cloud climatology cannot tell whether a particular week will clear.
The Norwegian and Icelandic pair makes the same point from a different direction. Tromsø’s Kp 1 threshold creates a larger annual Kp/darkness baseline than Reykjavík’s Kp 2 threshold, 164.26 versus 141.71 nights in this reference. Reykjavík’s cloud normal is 78.3% in January and 80.0% in March; Tromsø’s is 82.5% in January and 84.9% in March. These are gridded long-run means. They cannot resolve local microclimates, terrain effects, or a weather break within an individual night.
The shoulder-season difference worth knowing
Strict astronomical darkness does not disappear everywhere at once. Yellowknife still has a small August shoulder season in this calculation: 13.4% of August calendar nights contain any astronomical darkness, the mean is 1.68 hours on those qualifying nights, and the Kp-threshold baseline is 3.00 nights/year. That is a very different signal from a full winter month, but it is not zero.
For Fairbanks, Reykjavík, Tromsø, Rovaniemi and Abisko, May through August are zero under this strict −18° calculation. The distinction matters: zero means no modeled astronomical-darkness opportunity under this definition, not that bright aurora cannot be seen in twilight. NOAA notes that aurora is not visible in daylight, while bright aurora can sometimes be observed from a distance when conditions allow (NOAA SWPC).
Use the comparison for timing, then switch to live data
Use the figure to decide which component matters to the date you are considering. Compare a January and March window in Yellowknife, or a January and October window in Tromsø, by reading the darkness, Kp baseline and cloud-normal panels separately. Do not collapse them into a single winner.
For an actual evening, replace every long-run component with current conditions: a short-horizon aurora forecast, local cloud forecast, darkness, moonlight and a safe viewing location. NOAA’s OVATION product is a 30–90 minute forecast of aurora location and intensity, not a seasonal planning tool (NOAA SWPC).
Methods and limits
GFZ’s planetary Kp index is three-hourly and draws on 13 geomagnetic observatories (GFZ Potsdam). The calculation uses the GFZ definitive snapshot: 87,664 complete three-hour intervals from 1996-01-01 00:00 UTC through 2025-12-31 21:00 UTC, all def status, under CC BY 4.0. Attribute the data to GFZ German Research Centre for Geosciences; its Kp data publication is documented on the GFZ Kp page and its linked data publication/DOI.
Each three-hour Kp interval is represented by its midpoint for the darkness test. Solar nights are bucketed from local solar noon to the next local solar noon using longitude/15, without daylight-saving time; darkness hours use a separate 10-minute solar grid. Shorter-than-three-hour activity and partial overlap with darkness remain unresolved, so the calculation does not claim continuous night windows.
Darkness was calculated at 10-minute resolution. The strict −18° solar-altitude threshold excludes twilight, deliberately. AACGM-v2 2.7.1 at epoch 2026-07-01 and 110 km altitude supplies the fixed current 2026 AACGM latitude and threshold held across the historical record for a stable comparison; they are not reconstructed historical magnetic geometry. The sensitivity analysis shows that Reykjavík moves from an older static Kp 1 ladder to Kp 2 under the current reference, so the geometry assumption belongs in every caption.
NASA POWER monthly CLOUD_AMT climatology covers January 2001–December 2020 for these points. It is an all-day monthly mean, not night-only cloud data or historical cloud observations on the modeled Kp nights. NASA describes its climatology service as analysis-ready meteorological and solar data (NASA POWER documentation). A gridded mean cloud amount is not a probability of a clear or overcast night. A cloud-scaled Kp/darkness value may be supplied as an optional sensitivity index, but it must never replace the three component panels or be called visible nights, odds or a forecast.