Geomagnetic Storms 2025 vs 2024: Definitive Kp Data
Compare geomagnetic storms in 2024 and 2025 using definitive GFZ Kp data: UTC days, three-hour intervals, monthly differences and clear methods.
The short answer
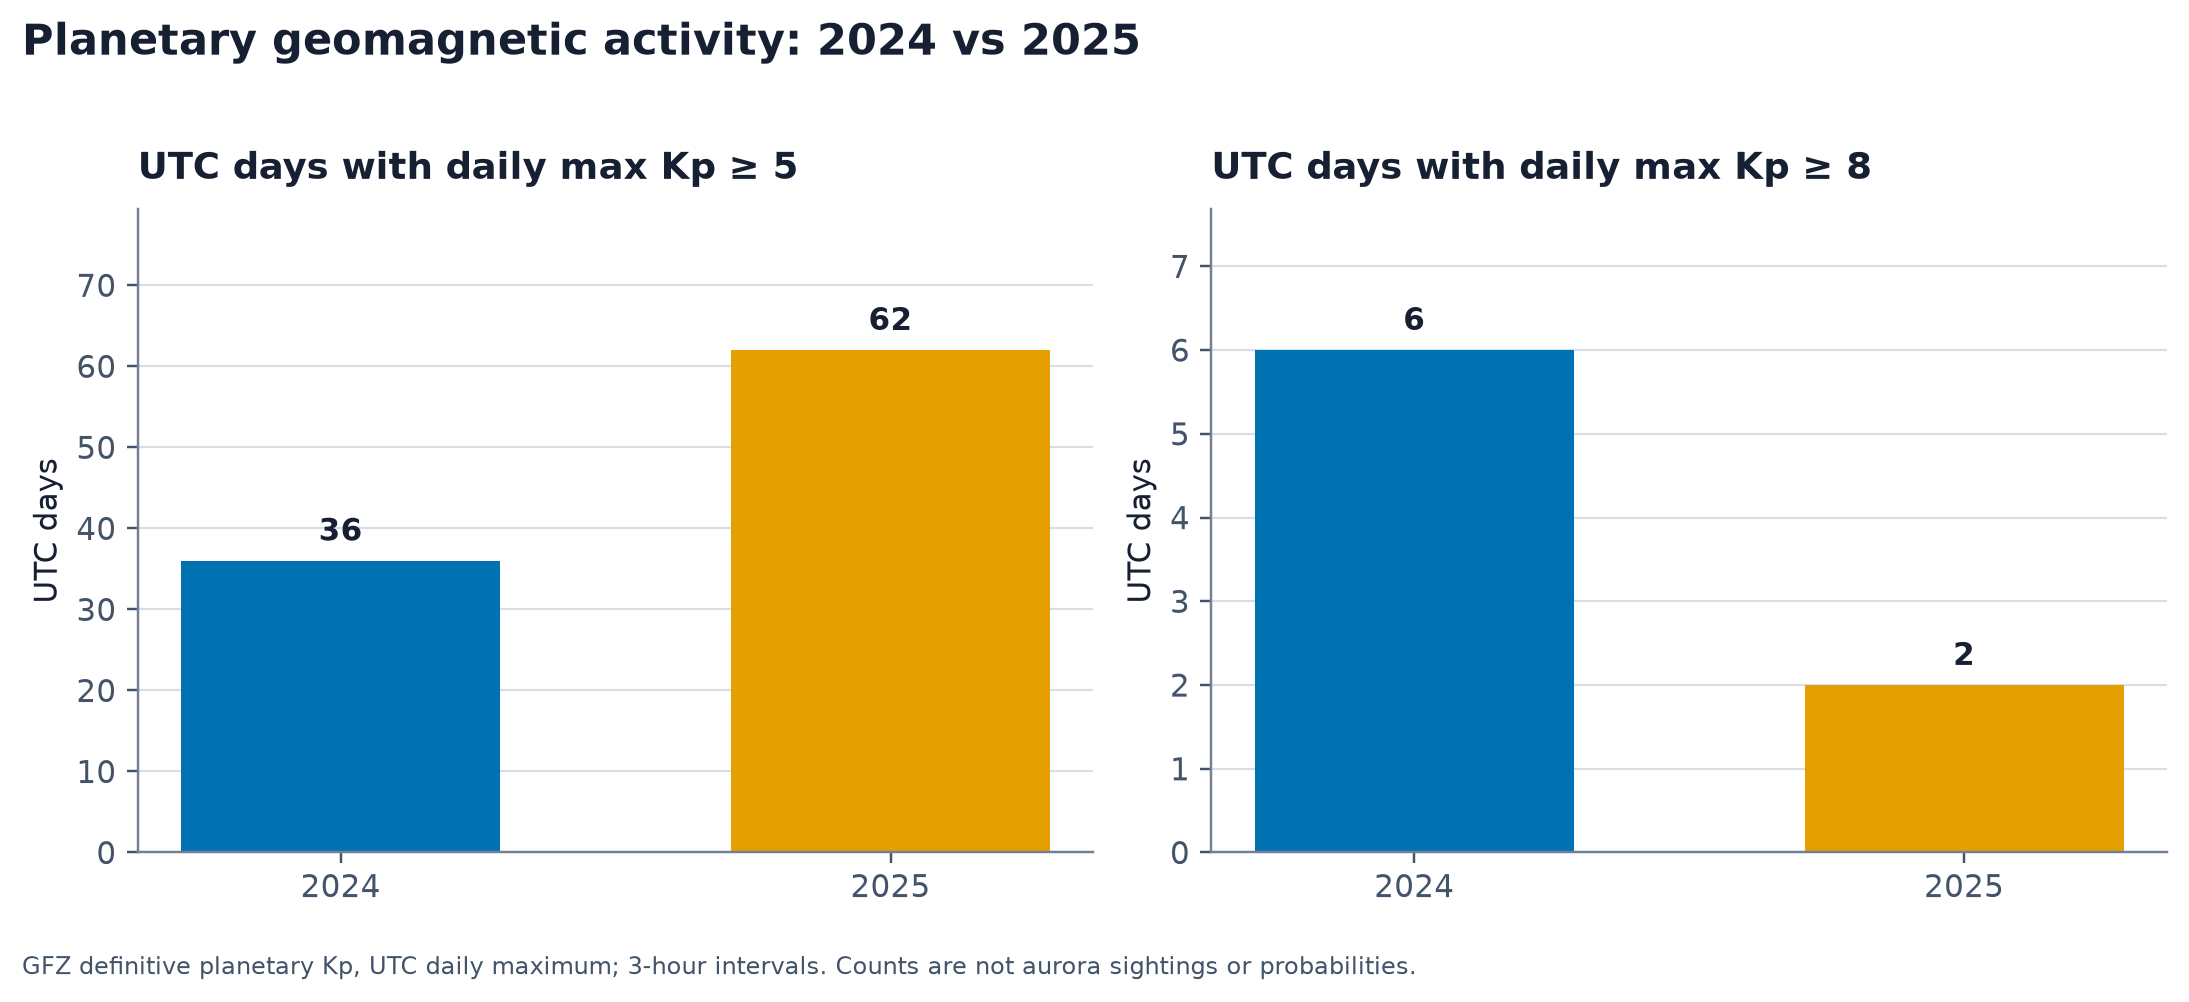
On the definitive planetary Kp record, 2025 had more frequent Kp 5.0-or-higher threshold crossings than 2024: 62 UTC days with at least one Kp interval at or above 5.0, compared with 36 in 2024. It also had 156 three-hour intervals at or above Kp 5.0, compared with 97 in 2024.
The high-end result points the other way. 2024 contained six UTC days and 13 three-hour intervals at or above Kp 8.0; 2025 contained two days and three intervals at that threshold. The annual maximum was Kp 9.0 in 2024 and Kp 8.667 in 2025.
Those are different measures of a global index. They do not count separate storms, aurora displays, viewing nights, or the likelihood of seeing aurora from any location. But together they answer a useful narrower question: 2025 had more days that crossed the Kp 5.0 threshold, while 2024 had more of the rare Kp 8.0-or-higher intervals.
What was counted
Kp is a planetary geomagnetic index reported in eight fixed three-hour UTC intervals per day. The official GFZ data description lists the bins as 00–03 through 21–24 UTC and records Kp in thirds, so values such as 8.667 are valid values rather than rounding errors. The source data here use the definitive GFZ series, not a live forecast or provisional display. GFZ’s data description documents both the cadence and the distinction between definitive and nowcast data.
For clarity, this analysis uses two simple thresholds:
- Kp ≥5.0: an interval or UTC day with at least one value at or above 5.0.
- Kp ≥8.0: an interval or UTC day with at least one value at or above 8.0.
NOAA maps integer Kp 5 through 9 to its G1 through G5 geomagnetic-storm scale. This article deliberately reports the numeric thresholds instead of relabelling every counted interval as a NOAA event category: the data are three-hour observations, while event duration and operational classification require separate definitions. NOAA’s K-index reference also cautions that real-time estimates may differ slightly from official values and that a global index can miss a localized disturbance.
The comparison in one table
| Definitive UTC measure | 2024 | 2025 | Difference, 2025 minus 2024 |
|---|---|---|---|
| Three-hour intervals observed | 2,928 | 2,920 | -8 (leap year) |
| Coverage of expected intervals | 100.0% | 100.0% | 0 percentage points |
| UTC days with daily maximum Kp ≥5.0 | 36 | 62 | +26 |
| Three-hour intervals Kp ≥5.0 | 97 | 156 | +59 |
| UTC days with daily maximum Kp ≥8.0 | 6 | 2 | -4 |
| Three-hour intervals Kp ≥8.0 | 13 | 3 | -10 |
| Annual maximum Kp | 9.0 | 8.667 | — |
The leap-year difference is expected: a complete leap year has eight more three-hour intervals than a complete non-leap year. Both years have complete coverage, so the threshold counts can be compared directly without estimating missing periods.
The headline difference at Kp 5.0 is substantial in absolute terms: 2025 had 26 more qualifying UTC days, a 72% increase over 2024’s 36. It also had 59 more qualifying three-hour intervals. These measures are related but not interchangeable. A day can contain one threshold-crossing interval or several; counting both makes the duration pattern visible without inventing an episode boundary.
At Kp 8.0, the picture reverses. The 2024 record includes three times as many qualifying UTC days and more than four times as many qualifying intervals as 2025. Its Kp 9.0 maximum is the top of the Kp scale. A planetary threshold count alone does not determine a local viewing outcome.
When the difference appeared
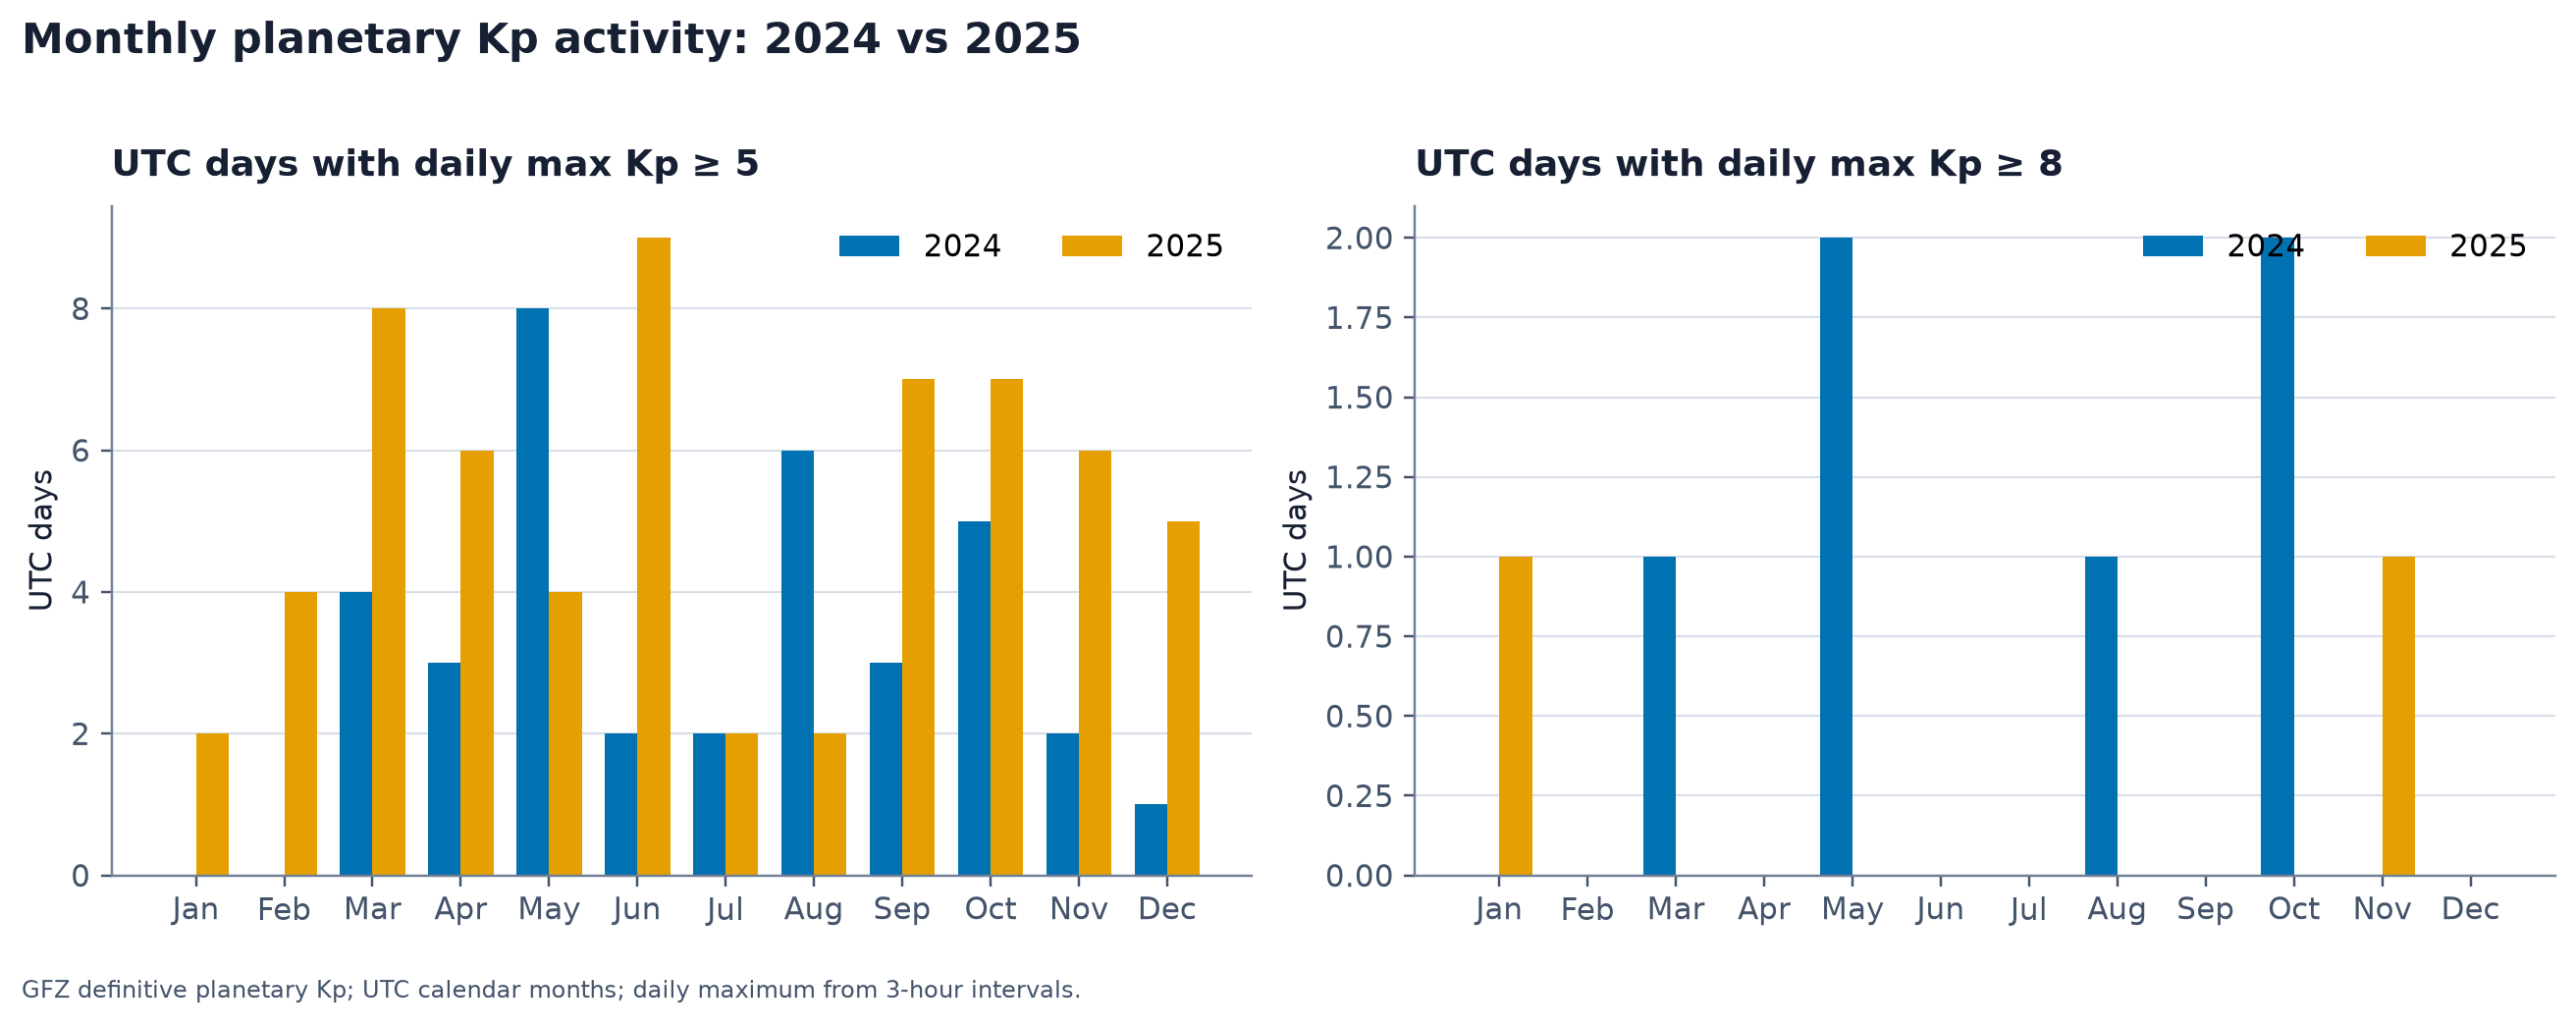
The calendar pattern explains the +26-day difference. Months where 2025 exceeded 2024 contributed 34 additional Kp ≥5.0 UTC days; May and August offset that total by eight. June was the largest single contribution, with nine qualifying days in 2025 against two in 2024. This is an accounting of the annual difference, not an explanation of its physical cause.
| Month | 2024 UTC days with maximum Kp ≥5.0 | 2025 | Difference |
|---|---|---|---|
| January | 0 | 2 | +2 |
| February | 0 | 4 | +4 |
| March | 4 | 8 | +4 |
| April | 3 | 6 | +3 |
| May | 8 | 4 | -4 |
| June | 2 | 9 | +7 |
| July | 2 | 2 | 0 |
| August | 6 | 2 | -4 |
| September | 3 | 7 | +4 |
| October | 5 | 7 | +2 |
| November | 2 | 6 | +4 |
| December | 1 | 5 | +4 |
| Full year | 36 | 62 | +26 |
The result is not a contradiction. A year can have more moderately elevated intervals spread across more days while another has fewer qualifying days but a more concentrated high-end tail. The choice of metric therefore needs to precede the conclusion, not follow it.
What this says about the solar cycle — and what it does not
NASA and NOAA announced in October 2024 that Solar Cycle 25 had reached its maximum period. That is useful background, not a causal explanation for either annual total. NOAA’s space-weather primer says geomagnetic storms are generally more frequent near solar maximum, but can also be common in the declining phase because of high-speed solar-wind streams.
At the event level, a coronal mass ejection’s speed, direction, density and magnetic-field direction affect whether and how strongly it disturbs Earth’s magnetosphere. NOAA notes that the magnetic field direction cannot be determined until measurement at a monitoring satellite, and that an oppositely directed field can produce a larger disturbance. Its CME explainer is a useful reason not to attribute a one-year count difference simply to the phase of the solar cycle.
The complete 2024 and 2025 records therefore show different distributions of global Kp threshold crossings. Here, 2025 leads on Kp ≥5.0 days and intervals; 2024 leads on Kp ≥8.0 days, intervals and annual maximum.
Methods, limitations and source note
The analysis used the definitive GFZ JSON API snapshot retrieved on 7 November 2026: /app/json/?start=1996-01-01T00:00:00Z&end=2025-12-31T23:59:59Z&index=Kp&status=def. Its 2024 and 2025 subsets contain 2,928 and 2,920 native three-hour UTC intervals respectively, each with 100.0% coverage. A “qualifying UTC day” means at least one of that day’s eight intervals met the stated numeric threshold. No Kp average was calculated or used.
Kp is nonlinear, so it should not be treated as an ordinary linear score and casually averaged. GFZ’s documentation recommends the linear ap/Ap family rather than the historic daily Kp sum for scientific daily aggregation. This article therefore stays with transparent threshold counts and the observed annual maximum.
The analysis does not apply a storm-event segmentation rule: a multi-interval disturbance can contribute several intervals and more than one UTC day. It contains no local aurora, weather or impact observations.
Source: Geomagnetic Kp index, GFZ Potsdam, DOI 10.5880/Kp.0001, CC BY 4.0, with the dataset and Matzka et al. (2021) attribution specified by GFZ.