Northern Lights Equinox Effect: 30 Years of Kp Data
Test the northern-lights equinox effect using 30 years of definitive Kp data, monthly rates, year-by-year variation and methods.
The short answer
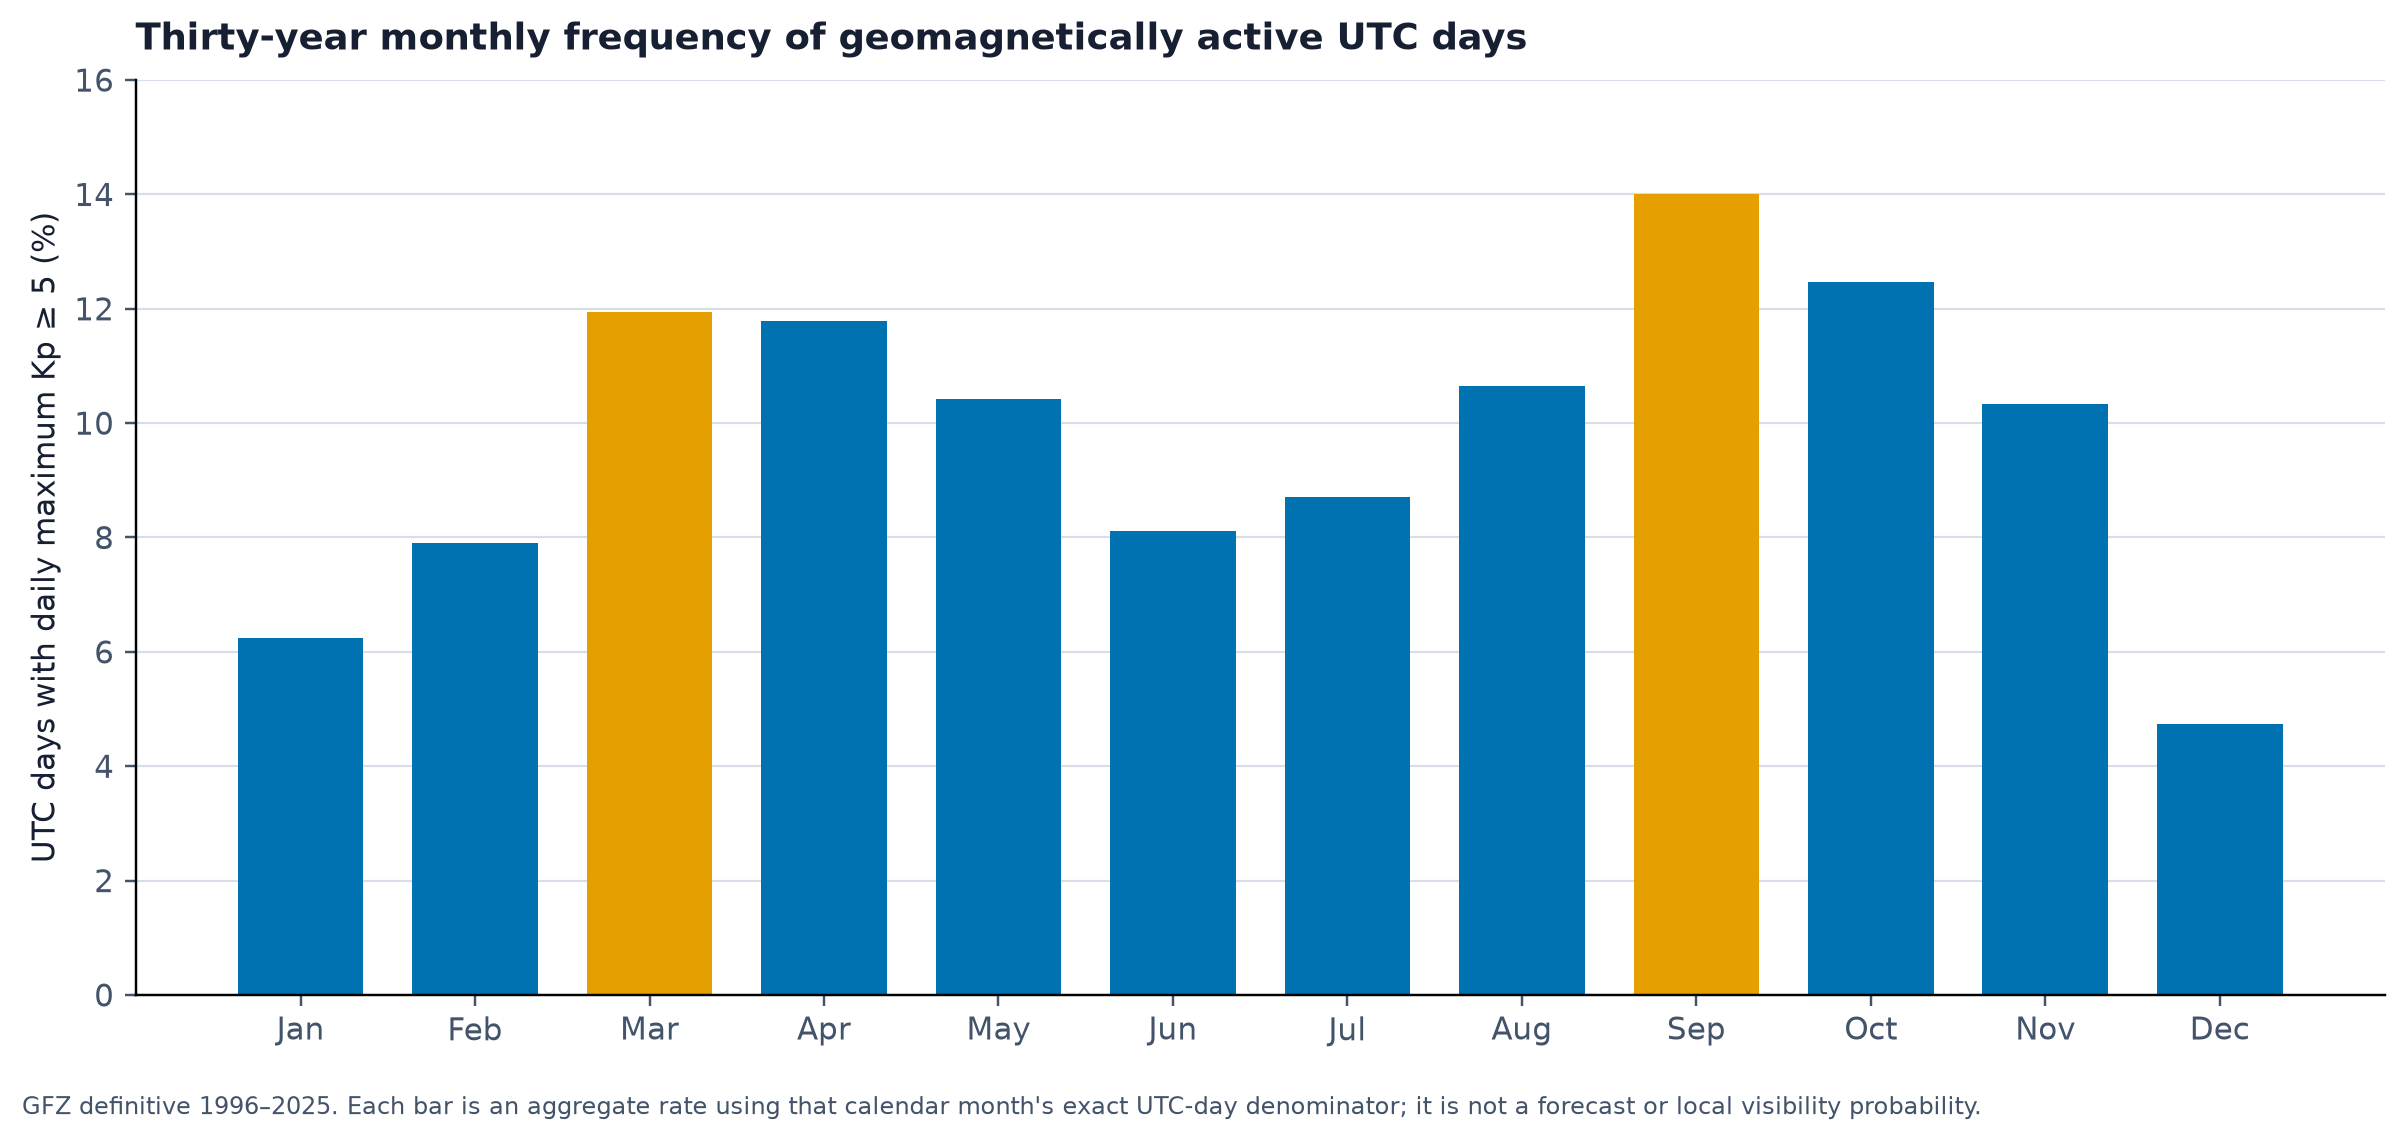
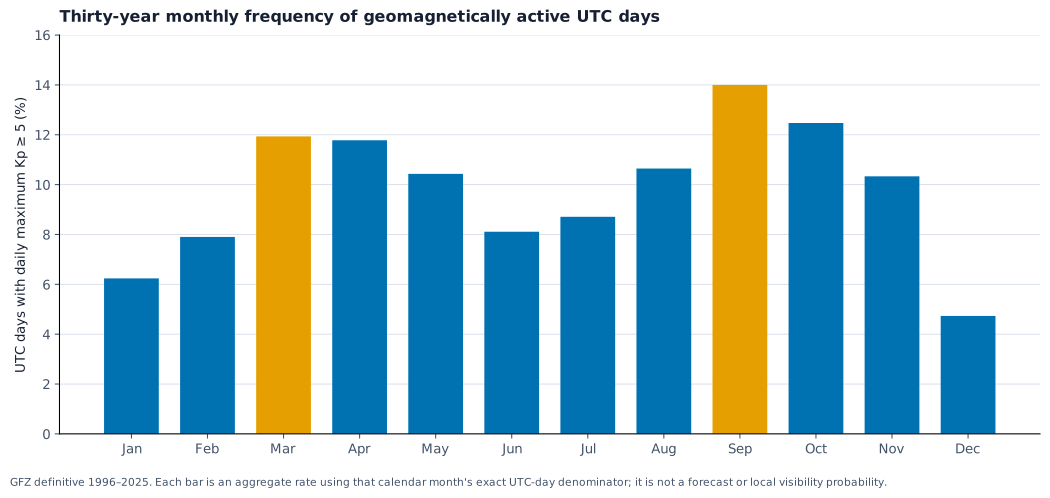
The 30 complete years of definitive GFZ planetary Kp data support an equinox-season pattern in global geomagnetic activity. From 1996 through 2025, 14.0% of September UTC days reached a daily maximum Kp of at least 5.0. March reached 11.9%. December reached 4.7%.
For a city-level plan, read this activity pattern beside local darkness, cloud, Moon, light pollution and an open horizon. Within the complete planetary record, elevated geomagnetic activity occurred more often in March and September than in December after accounting for the different number of days in each month.
What this study measures
The source is GFZ Potsdam’s definitive planetary Kp record, in its native three-hour UTC observations. For each of the 10,958 UTC calendar days from 1996-01-01 through 2025-12-31, we used that day’s highest Kp value and recorded whether it reached Kp 5.0 or higher. Kp 5 corresponds to NOAA’s G1 threshold, but this is deliberately a transparent numerical count of daily maxima, not a catalogue of separate storm events.
The result is a rate: qualifying UTC days divided by every UTC day in that calendar month across the 30 years. This avoids a simple count making 31-day months look more active just because they are longer. Kp is nonlinear, so it is not averaged or summed.
The full monthly record
| Month | UTC days with daily max Kp ≥5 | All UTC days | Share |
|---|---|---|---|
| January | 58 | 930 | 6.2% |
| February | 67 | 848 | 7.9% |
| March | 111 | 930 | 11.9% |
| April | 106 | 900 | 11.8% |
| May | 97 | 930 | 10.4% |
| June | 73 | 900 | 8.1% |
| July | 81 | 930 | 8.7% |
| August | 99 | 930 | 10.6% |
| September | 126 | 900 | 14.0% |
| October | 116 | 930 | 12.5% |
| November | 93 | 900 | 10.3% |
| December | 44 | 930 | 4.7% |
September is the highest month in this threshold measure, followed by October. March and April form a second elevated part of the year. December is the lowest. For travel, pair those activity rates with the local darkness calendar: December can provide abundant darkness, while strict astronomical darkness becomes short or absent near a spring equinox at high latitudes.
That is why the eight-city northern-lights calendar keeps historical activity, calculated darkness and cloud normals in separate panels. Its December result answers a different part of the planning problem. The best-time guide and the summer and twilight guide put the Sun’s seasonal geometry beside that activity context.
Use the table to choose a season worth monitoring, then narrow the decision to a city and a date. September combines the highest activity rate in this record with a returning northern darkness season; March combines an elevated rate with rapidly changing night length. The relevant trade-off is different in every destination.
Does one active era create the pattern?
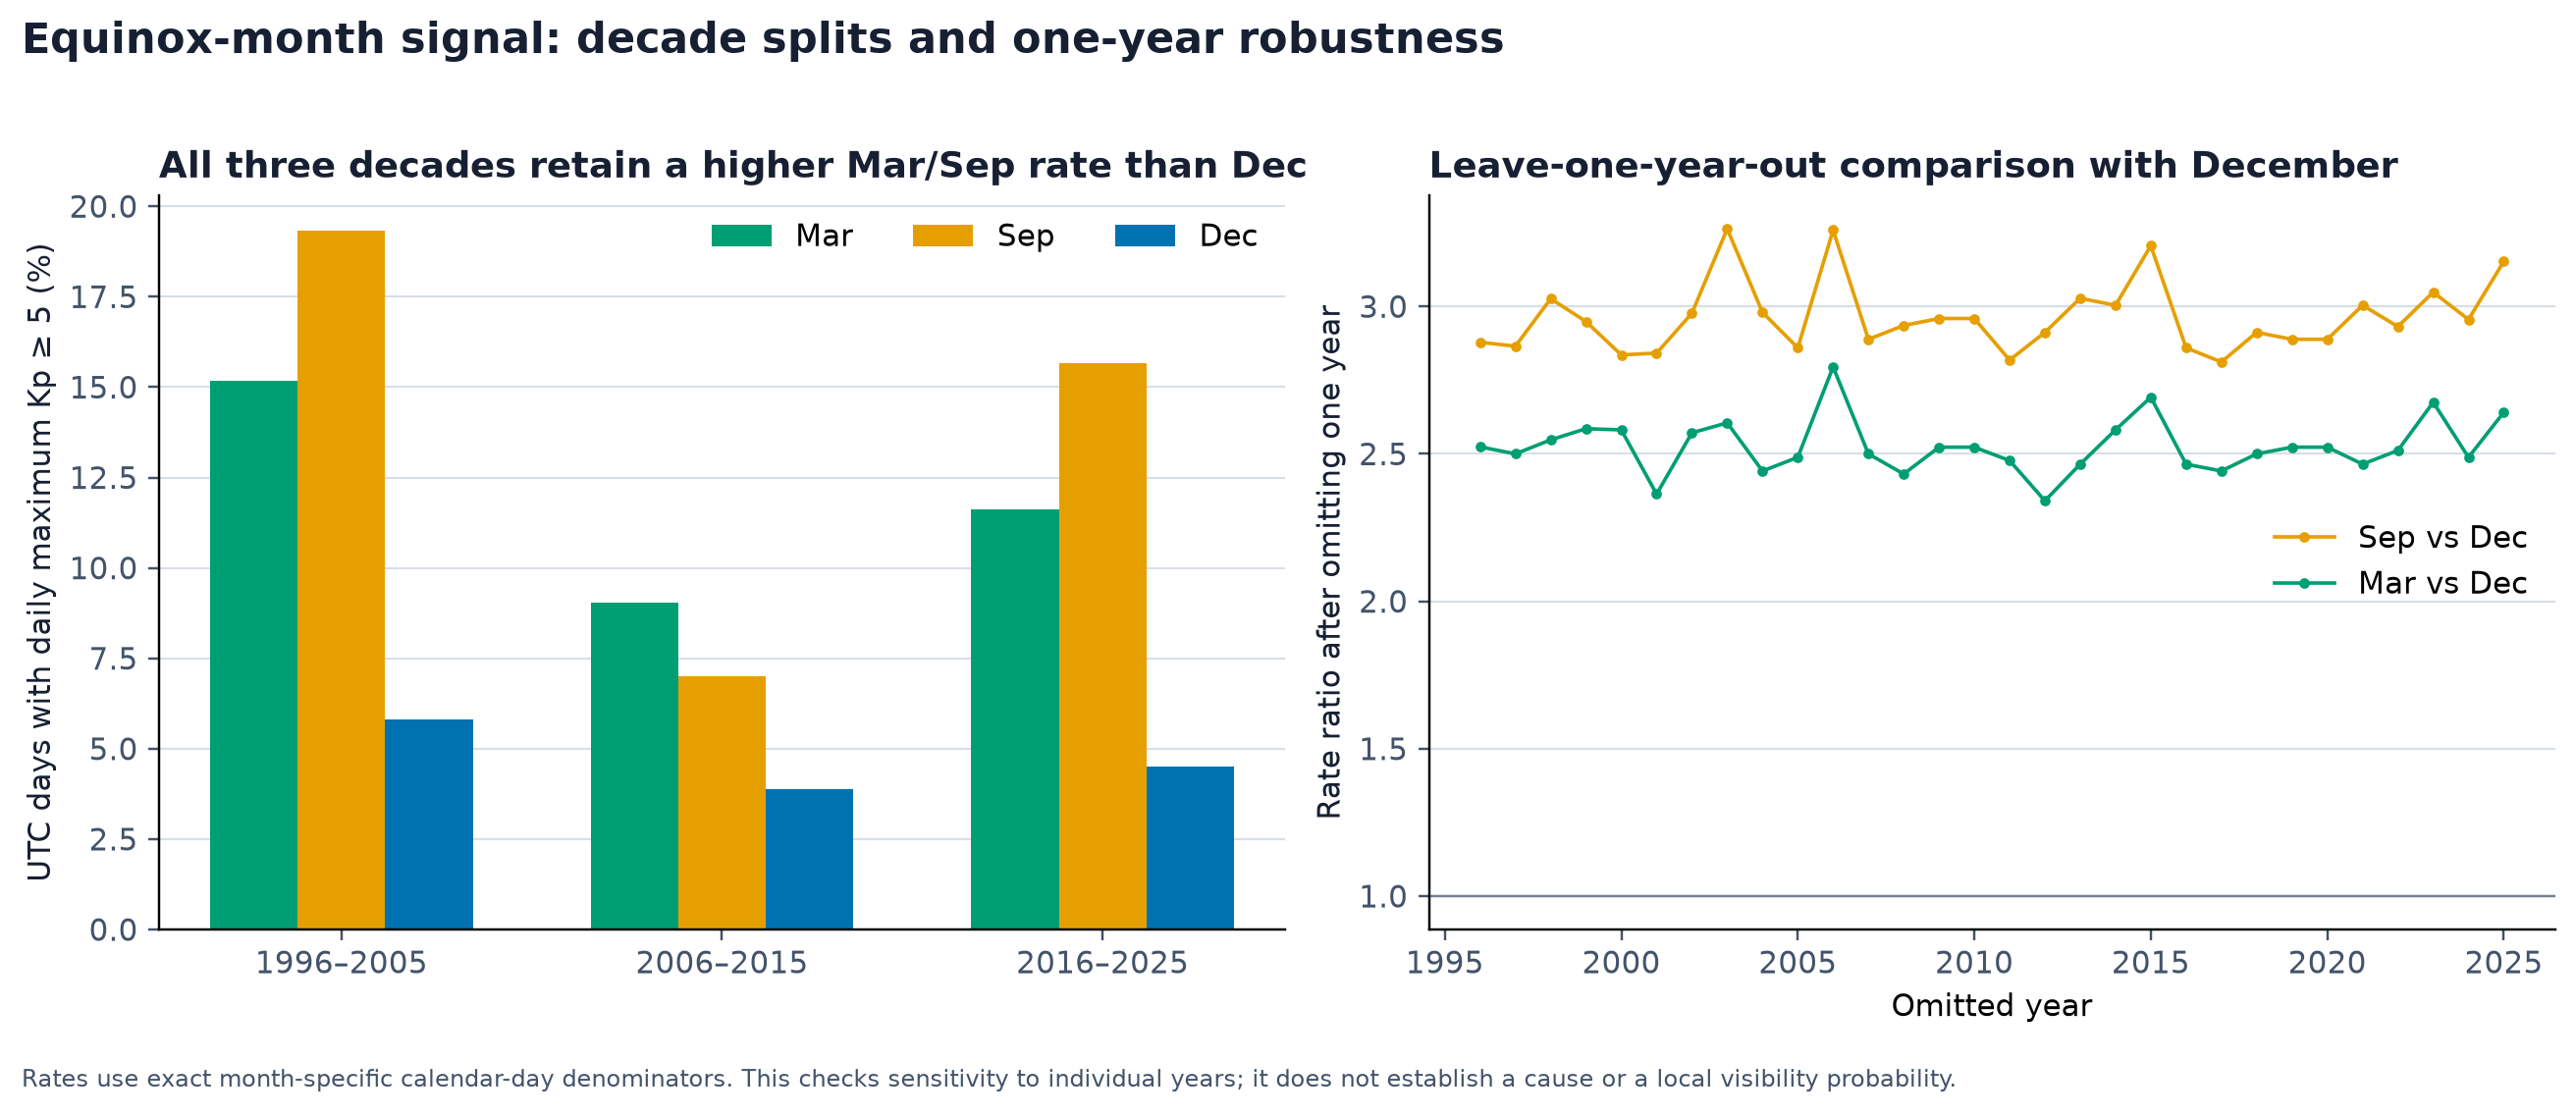
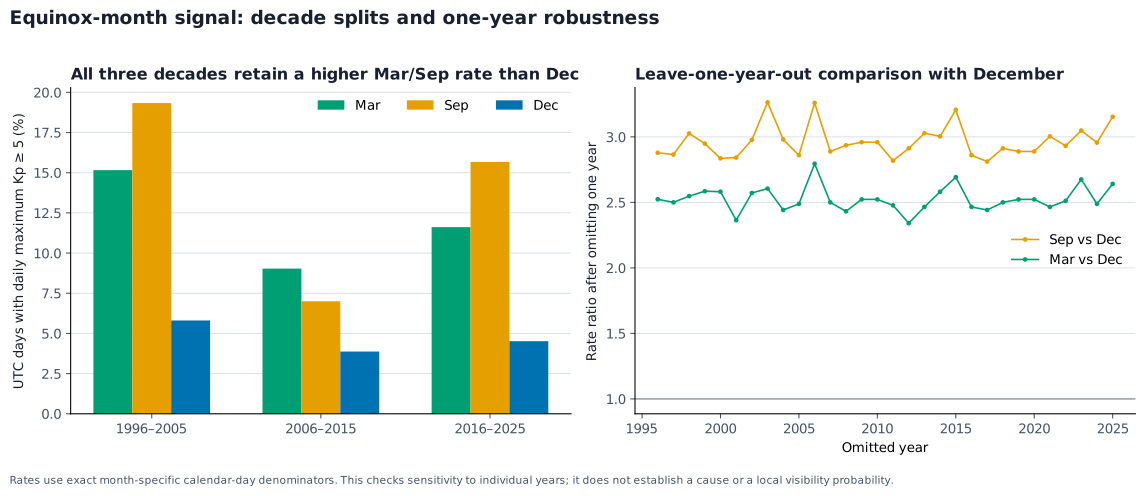
The decade split says no, though it does show that the size of the pattern changes. In 1996–2005, March, September and December rates were 15.2%, 19.3% and 5.8%. In 2006–2015 they were 9.0%, 7.0% and 3.9%. In 2016–2025 they were 11.6%, 15.7% and 4.5%.
The comparison also survives a simple sensitivity check. We recalculated each March-to-December and September-to-December rate ratio 30 times, leaving out one year at a time. September remained 2.81 to 3.26 times December’s rate; March remained 2.34 to 2.79 times December’s. This is a robustness description, not a formal significance claim: adjacent days within one geomagnetic disturbance are related, and the calculation does not turn them into independent events.
Why equinox seasons can matter
The Russell–McPherron effect describes one seasonal geometry that can make transfer of solar-wind energy into Earth’s magnetosphere more favorable around the equinoxes. NASA explains that Earth’s magnetic-field orientation relative to the solar wind changes with season, and that this geometry favors transfer in spring and fall. NASA’s overview identifies it as one reason astronauts see more aurora around equinoxes.
That geometry works alongside the incoming solar wind. NOAA identifies sustained high-speed solar wind and a southward magnetic field as effective inputs for geomagnetic storms in its storm overview. The Kp analysis documents the month-by-month pattern; it does not assign individual active days, or all seasonal variation, to the Russell–McPherron effect.
Turning a seasonal reference into a viewing plan
For a trip, begin with whether the destination becomes dark enough at your dates. At high latitudes, strict astronomical darkness can be short or absent around spring; in autumn it returns while the same seasonal activity context is present. Then compare a date’s cloud forecast, Moon conditions and light pollution. A full Moon can reduce contrast for faint features, which is why our Moon guide separates illumination from whether the Moon is actually above the horizon.
For the actual evening, check a location’s live forecast and local weather, then use the how to check aurora tonight guide to decide whether it is worth going out. The Kp index explainer shows how the useful threshold changes with magnetic latitude.
Methods, files and limitations
The analysis uses the GFZ JSON API snapshot retrieved on 7 November 2026: 87,664 definitive three-hour observations, complete from 1996-01-01 00:00 UTC through 2025-12-31 21:00 UTC. GFZ publishes the source as Geomagnetic Kp index, DOI 10.5880/Kp.0001, under CC BY 4.0. The raw definitive source is available as a compressed CSV; this page’s exact inputs and definitions are in the source manifest.
Each UTC day contributes once, using its highest observed Kp. The analysis excludes 2026 because it is incomplete. Kp reports global geomagnetic disturbance, not visible aurora, cloud-free hours, local sky brightness or a probability that a trip succeeds. The AuroraMe methodology explains how those separate live inputs are handled in a forecast. The seasonal chart is therefore a historical planning reference, not a promise for a city or a night.